Stress-Strain Curve is explained along with a detailed diagram and explanation of each point in the curve to better understanding. Here, we will learn the curve, along with a diagram, stress strain diagram of many materials, their characteristics. Let’s explore!
What is Stress-Strain Curve? Definition
Stress-Strain Curve Definition
Stress-Strain Curve, as the name suggests, it’s basically related to material’s stress and strain. Stress strain curve is defined as the curve or a graphical representation of a material’s stress and its strain and understood the relationship between stress and strain.
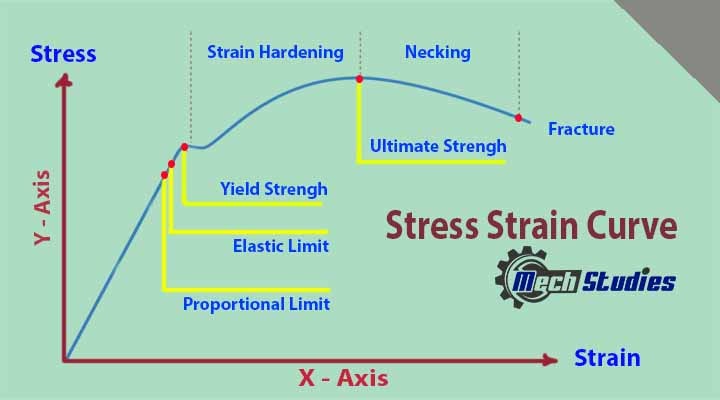
- Stress is represented along the Y-Axis
- Strain is represented along the X-axis
Why Stress Strain curve is required?
The importance of stress strain curve is very crucial, as it establishes the relationship between stress and strain. We can easily understand the behavior of any material with respect to the application of stress.
- Selection of right material is based on stress strain curve.
- In various industry, material selection is one of the main criteria and this diagram helps for the selection.
- From vehicle to airplane, medical appliances etc., precision materials are required and this is selected based on stress strain curve only.
- It gives deformation point as well as criteria so that application can be easily studied.
- It describes many properties of materials like Young’s modulus, ultimate tensile strength, the yield strength etc.
- It also gives material strength, elasticity, strain energy, elongation, toughness etc.
- In case of fabrication, this curve helps a lot during its operation.
However, before going to the stress strain curve, we will try to understand what is stress and strain and the relation between stress vs strain.
Stress vs Strain
We have already seen that we can stretch a rubber very easily and if we stretch it more at a certain point it will be broken. But, what about if we try to stretch an iron rod? Will the iron rod be stretched? Or if it is stretched will it be broken?
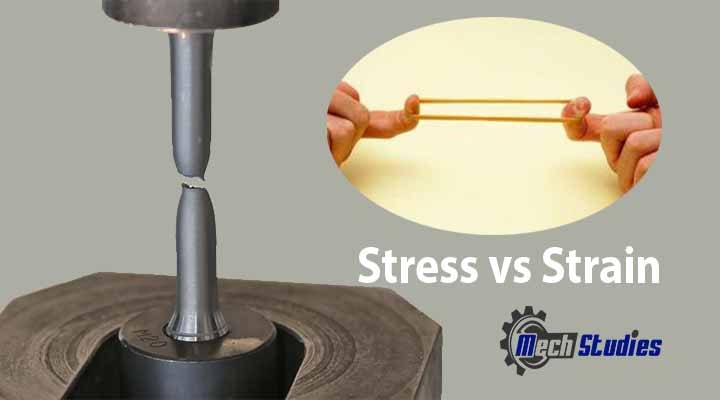
Here, the concept of stress strain comes into the picture.
Basics of Stress
If force is applied to a material, it can be stretched or compressed. Now, stress is defined as the force applied per unit area. It is denoted as σ (Sigma) and written as,
- σ = Forced / Area
- σ=F/A
Where,
- σ = Stress applied
- F = Applied force
- A = Area of force application
The unit of stress is N/m2
Remember the following,
- It is the stress increases the length of a material or a body, it will be called as tensile stress. In the application of tensile stress, body will be longer in length and thinner.
- It is the stress decreases length of a material or a body, it will be called as compressive stress. In the application of compressive stress, body will be shorter and thicker.
Basics of Strain
Now, the application of force incurs deformation on the body. Strain is related to deformation and it is defined as the ratio of deformation of the body in the direction of force applied to the initial dimensions of the body. The strain is written, as follows,
ϵ=δl/L
Where,
- ϵ: Strain due to stress applied
- δl: Change in length
- L: Original length of the material.
Remember the following,
- Strain is a dimensionless quantity.
- Tensile strain means the change in length by the tensile stress application.
- Compressive strain means the change in length by the application of compressive strain.
Stress vs Strain
Stress vs strain relation is stated with the use of Hooke’s law, Stress is proportional to strain and it is known as Hooke’s Law. Hence, we can write as per Hooke’s Law,
Stress ∝ Strain
σ ∝ ε
σ = E x ε
E = σ / ε
E = (Fn / A) / (dl / lo)
Where, E = Young’s Modulus (N/m2) (lb/in2, psi)
Modulus of Elasticity, or Young’s Modulus, is commonly used for metals and metal alloys and expressed in terms 106 lbf/in2, N/m2 or Pa. Tensile modulus is often used for plastics and is expressed in terms 105 lbf/in2 or GPa.
Stress Strain Diagram
Let’s try to understand stress-stress curve with a stress strain diagram. Let’s take an example of steel to study the deformation in the application of stress to have a clear idea.
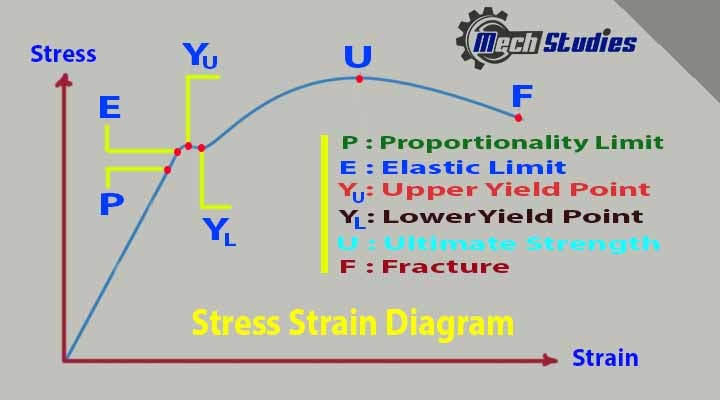
There are several points of interest in the diagram above:
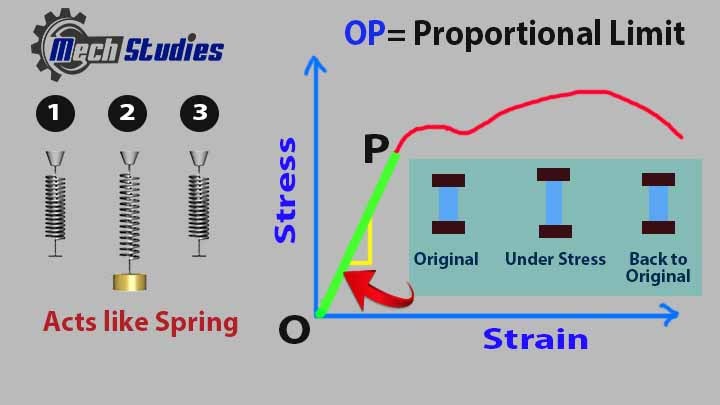
- P: Proportional limit,
- E: Elastic limit,
- YU: Upper yield point,
- YL: Lower yield point,
- U: Ultimate strength,
- F: Fracture point or the breakpoint,
Different material has different stress-strain graph and it looks different based on the characteristics. We will learn all these in brief later. Now, we will discuss all the points in detail. So, how does this curve generated?
How does stress-strain curve is generated?
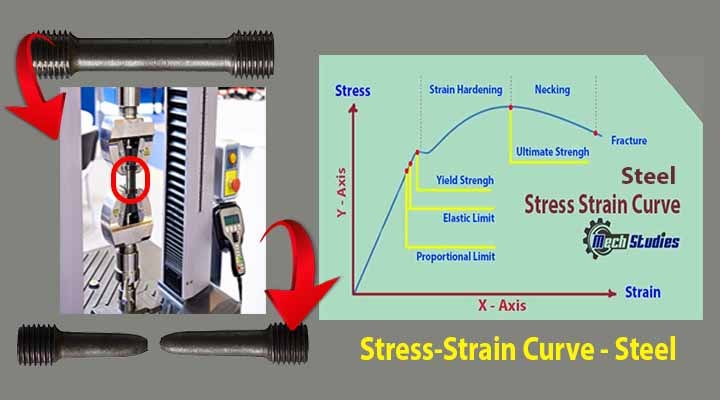
The stress strain curve is plotted in Universal Testing Machine (UTM). In this machine, there are two claws to hold the material and apply uniform pressure to deform. The force applied and the strain produced are recorded until a fracture occurs. The two parameters are then plotted on an X-Y graph to get the familiar graph.

Here, stress is applied to the steel and provides a gradual tension up to its failure. The entire process is plotted in a curve and the same is known as stress-strain curve of steel.
Stress-strain curve of materials
Stress strain curve of steel, aluminum, cast iron, elastomers etc., are described.
Stress Strain Curve for Steel
Curve: Refer to below diagram for stress strain curve of steel.
Parts of Stress Strain Curve
The stress strain curve describes many engineering parameters, like
- Proportional Limit
- Young’s Modulus of Elasticity
- Elastic Point & Yield Point
- Plastic Behavior
- Necking
- Fracture
- Yield strength
- Ultimate Tensile Strength
- Young’s Modulus:
Basic of Stress Strain Curve
In this graph, as the stress increases, the strain also increases. Steel is considered for the example of stress-strain curve as it is a little complex rather than brittle material. Stress-strain curve for brittle is so simple & we will learn after ductile material. Stress is proportional to strain, as per Hooke’s Law. That means,
- If tensile stress is increased, strain or length will increase
- If tensile stress is decrease, strain or length will decrease
Based on the application of stress, various points are created in the stress strain curve, let’s describe.
Description of Stress Strain Curve
The points in the stress strain curve are as follows,
Proportional Limit
All the metals behave like an elastic material up to a specific range. It means after the application of stress; the material returns back to its original dimension or shape. The point up to which the material behaves this proportionality is called the proportional limit.
This proportional limit depends on the following,
- Type of materials
- Material strength
- Grain size
- Working temperature
- Corrosion
In this proportional limit,
- No permanent deformation
- Metal behave like a spring
When the machine pulls the object at the ends, the object experiences tensile stress. Up to the proportionality limit, it obeys Hooke’s law, and the ratio of stress and strain is constant. This constant is called Young’s modulus of elasticity in material science.
Young’s Modulus of Elasticity
Young modulus of elasticity = longitudinal stress / strain
Hence, Young modulus of elasticity is defined as the ratio of longitudinal stress to strain within the proportional limit of a material.
- This modulus is also called as modulus of resilience.
- If Young’s modulus is more, force required will be more.
Refer young’s modulus value of few commonly used materials,
| Material | Young’s Modulus Pa (N/m2) |
| Steel | 200 x 109 |
| Copper | 110 x 109 |
| Iron | 91 x 109 |
| Brass | 91 x 109 |
| Glass | 55 x 109 |
Elastic Point
When the tensile force is increasing further, stress will increase beyond the proportionality limit. After this limit, a small portion of stress strain curve acts elastically. That means, in this region, if tensile stress is removed from the material, it will return to its original length.
- In this portion, the relationship between stress and strain deviates and so it doesn’t obey Hooke’s law.
- The strain is increased at a faster rate with respect to stress.
- A mild flattening region in created on the curve.
- Removal of tensile stress, metal returns it original length.
- The change in length within this elastic limit, is temporary.
Yield Strength & Yield Point
If we increase the tensile force on the metal further, tensile stress will increase and the material will cross the elastic limit and start to deform or yield. This point where deformation starts is called as yield point and the stress which creates this deformation is known as yield strength.
- It is the maximum stress beyond which the elongation becomes plastic.
- Beyond this point, permanent deformation starts.
- In the yield strength point, with a very little application of loads results in large deformation.
- Below the yield point, the material can return back to its original length if the load is removed.
- The yield point is two types – upper yield point & lower yield point.
- In the case of the upper yield point, stress requirements are maximum for the starting of plastic deformation.
- In the case of lower yield point, lower stress required to maintain plastic deformation.
After yield strength, Hooke’s law is deviated and different material acts differently. To avert this problem, a new term, proof stress is introduced. Proof Stress is nothing but a parallel line to the straight portion of stress strain curve at a strain value of 2%.
Ultimate Tensile Strength
The ultimate tensile strength is the maximum stress value before its failure and it is the highest stress value in any curve.
- It is denoted as UTS.
- It’s basically the maximum resistance to fracture.
- UTS can be decided precisely for all kinds of materials.
- UTS is used as a main stress for brittle material’s design calculation.
Plastic Behavior
After the elastic point, the elasticity of the material is lost and strain hardening region in the curve started.
- At yield strength point, plastic deformation starts.
- Once the material is taken out from the machine, it will not be able to return to its original shape or length.
Strain Hardening
Material experiences a very high rate of plastic deformation after yield point. After ultimate tensile strength, ductile material can be able to support load up to a very small extent. Once the material yields, strain harden starts, it increases the strength of the material.
- Strain harden is seen between yield point and ultimate tensile strength.
- Brittle material may not have yielding behavior that means strain hardening is not applicable.
In strain hardening, molecules are obstructing each other and rearranged. This rearrangement helps the metal to increase its strength.
Necking
Necking means simply the formation of neck. When the plastic deformation continues, with increasing the tensile stress, the material starts to form its neck, that is narrowing its cross-section.
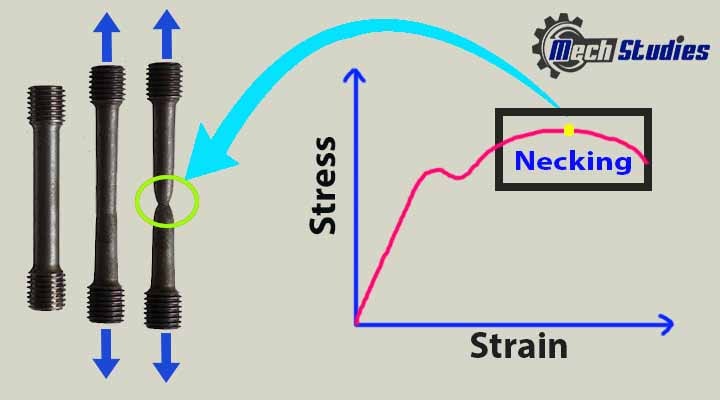
This phenomenon is called necking.
- Neck formation happens at the weakest point of the material.
- Starting point of necking gives us the UTS of a material.
Fracture
In the necking region, plastic deformation happens. In this region of the stress-strain curve, no need to increase the load further, to experience the plastic deformation. A fracture occurred at the neck. The point at which fracture happens is known as the fracture point.
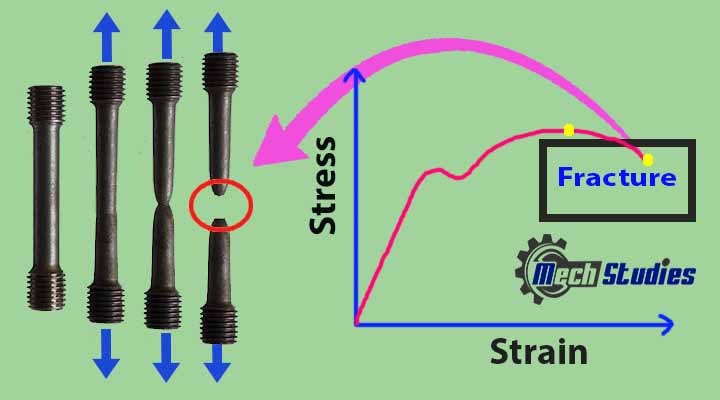
- Fracture creates two shapes, a cup & cone at either end.
- The fracture point is denoted by E on the stress-strain curve.
Stress-Strain Curve of Other Materials
Stress-strain curve of other materials like aluminium, concrete, cast iron, elastomers, perfectly plastic materials are required for their formation or making other materials are necessary. We will discuss, this curve of a few widely used materials, as follows,
- Aluminum
- Rubber
- Concrete
- Cast Iron
- Elastomers
- Perfectly Plastic Materials
Stress-Strain Curve of Aluminium Alloy
We have already learned that yield stress is measured by drawing a proof stress if a material doesn’t have distinct yield stress. In case of aluminum or aluminum alloys, there is no distinct yield stress so proof stress is adopted.
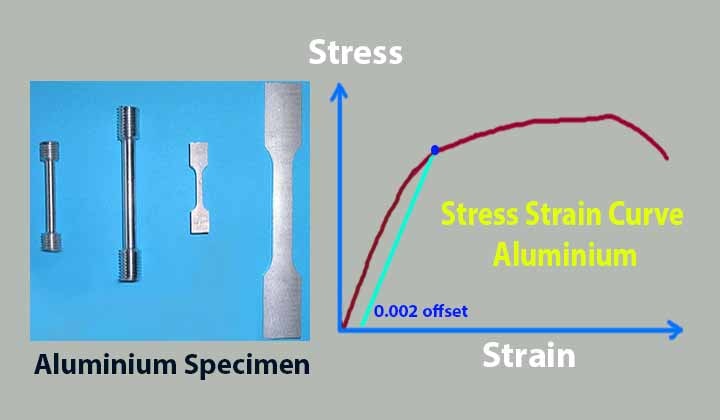
- Proof stress line is drawn at 0.002.
- The intersection point between the proof stress and curve will be the ultimate stress.
- This yield stress is measured by the offset method, hence, it is also known as offset yield stress.
Stress-Strain Curve of Rubber
The curve for rubber is linear within the proportionality limit and it is with a high strain value around 0.1 to 0.2.
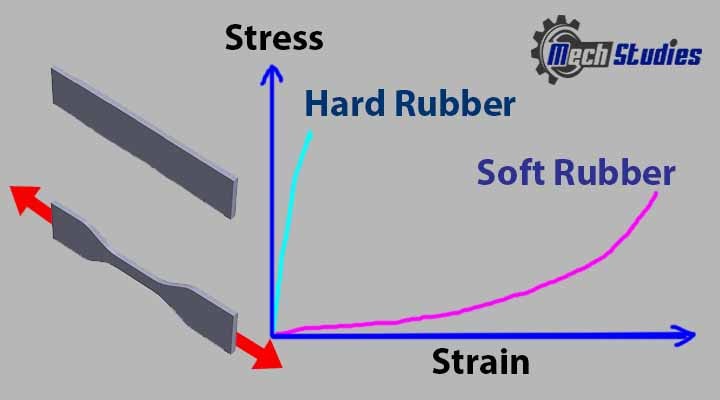
After proportionality limit, stress diagram depends on the type of rubber,
- Soft rubber undergoes a large elongation without failure.
- Hard rubber initially resists against stress and after that curve goes sharply.
Stress-Strain Curve of Concrete
To know the behavior of concrete for the use of construction, this curve is required to study.
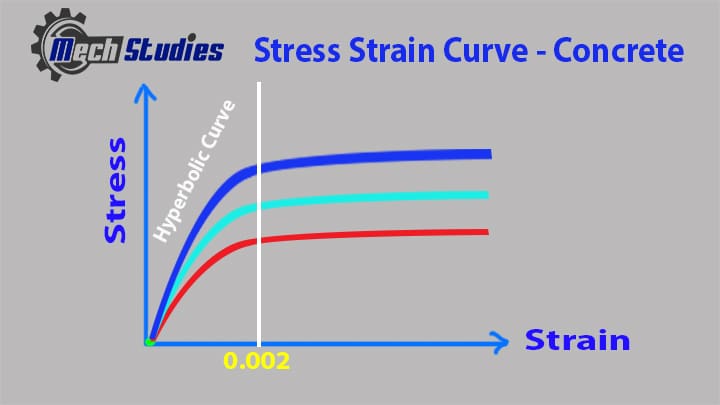
- Stress and strain is proportional at the initial stage,
- Material can retain it’s original state after removing load at this stage,
- After increasing further load, concrete exhibits nonlinear plastic behavior,
- Curve then becomes horizontal and reaches to maximum compressive strength.
Stress-Strain Curve for Cast Iron
Cast Iron is not a ductile material, instead it is a brittle material. We have already learned that for all brittle materials, material fracture suddenly.

So, tensile strength is the main driving parameter for brittle materials to get the behavior of the materials. Cast iron is falling under this category. Refer to the diagram for cast iron.
Stress-Strain Curve for Elastomers
Elastomers mean a material that can be stretched up to double its length at normal conditions without any permanent deformation.
- Elastomers are formed by crosslinking between molecules.
- It creates a large flat region on the curve upon stretching.
- Hooke’s law is not applicable in most of the parts of this curve.
There are many elastomers used in various industries, which exhibits the same curves,
- Plastic material.
- Brittle polymer.
- Styrene-butadiene rubber (SBR) etc.
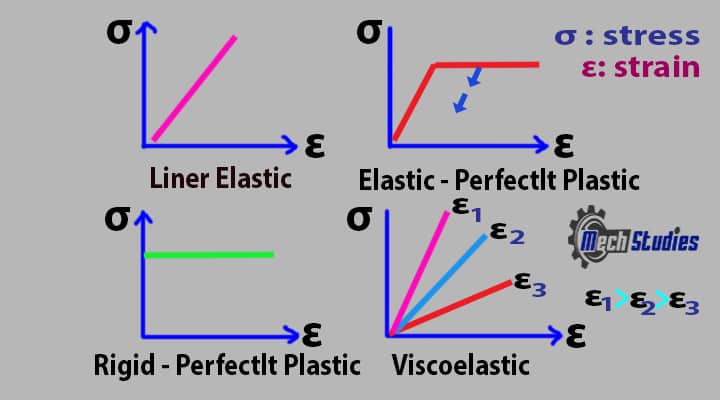
Stress-Strain Curve for Perfectly Plastic Materials
We have already learned strain hardening or work-hardening. In the case of perfectly plastic materials,
- There will not be any work hardening during plastic deformation.
- It shows linear elastic properties in the curve up to the yield stress.
- After yield stress, it exhibits ideal plastic properties.
Look at the stress-strain curve for,
- Linear elastic,
- Perfectly plastic (Elastic),
- Perfectly plastic (Rigid)
- Viscoelastic.
Ductile vs. Brittle – Stress-Strain Curves
If a material breaks without any plastic deformation, the material is known as a brittle material. On the other hand, all ductile materials experience plastic deformation before failure. We can distinguish ductile vs brittle – stress-strain curves, as below,
| Description | Ductile Material | Brittle Material |
| Plastic Deformation | Undergo plastic deformation before failure | No plastic deformation or negligible plastic deformation before failure |
| Elongation | Elongation is more | Very less elongation |
| Energy absorb | Energy absorb before fracture is high | Less energy absorbs |
| Wire | Wire can be made from this kind of material | Not recommended |
| Bending | It can bend | Difficult due to failure |
| Shear Fracture | Better shear fracture | Not good |
| Crack | Crack propagates slowly | Crack propagates fast |
| Forming Process | Forming process can be done | Very difficult |
| Life | Longer life if it is subjected to fatigue loading. | Comparatively short life if it is subjected to fatigue loading. |
| Examples | Mild steel Copper Aluminum Silver Rubber Many Plastics | Cast iron Concrete Ice Stone Ceramics Glass etc. |
Conclusion
Hence, we have got a basic concept of stress, strain, and stress-strain curve along with a detailed explanation. Any doubt, please feel free to write.
Very interesting info !Perfect just what I was looking for!
Howdy! I could have sworn I’ve been to this website before but after checking through some of the post I realized it’s new to me. Anyhow, I’m definitely happy I found it and I’ll be book-marking and checking back often!
Thanks a lot for producing this worthwhile post. Let me without a doubt return down the road to read more.
I would like to thnkx for the efforts you have put in writing this blog. I’m hoping the same high-grade website post from you in the upcoming also. Actually your creative writing skills has inspired me to get my own site now. Actually the blogging is spreading its wings rapidly. Your write up is a good example of it.
I just added this blog to my rss reader, excellent stuff. Cannot get enough!
Hiya, I am really glad I have found this information. Nowadays bloggers publish just about gossips and web and this is actually annoying. A good site with exciting content, that’s what I need. Thanks for keeping this web-site, I’ll be visiting it. Do you do newsletters? Cant find it.